Most D2C founders can tell you their GMV. Few can tell you their contribution margin per order. Fewer still can tell you their contribution margin per order per courier per city. That's the difference between a brand that looks successful and one that actually is.
The D2C playbook has changed. In 2024, you raised money and bought growth. In 2026, investors want profitability. Customers cost more to acquire (+40% CAC increase in 2 years), couriers cost more to ship with, and ad platforms keep taking a bigger cut. The brands winning now aren't the ones with the highest GMV — they're the ones who understand their numbers at the order level.
Important
A Shopify store doing ₹50 lakh/month in revenue can be less profitable than one doing ₹15 lakh — if the first brand doesn't understand unit economics. Revenue is vanity. Contribution margin is sanity. Profit is reality.
The 7 Metrics That Matter
1. Customer Acquisition Cost (CAC)
What it is: Total marketing spend ÷ Number of new customers acquired.
Why it matters on Shopify: If you're running Meta Ads and Google Ads into your Shopify store, your CAC is the gatekeeper to profitability. An ₹800 CAC on a ₹1,200 AOV product with 40% COGS means you're making ₹80 before logistics. One RTO and you're negative.
How to track it: Most brands calculate CAC monthly from ad dashboards. But monthly CAC hides daily volatility. During sale events, your CAC drops 30%. On normal days, it spikes 50%. You need daily CAC visibility to make real-time bidding decisions.
Benchmark for Indian D2C (2026):
| Category | Healthy CAC | Danger Zone |
|---|---|---|
| Fashion & Apparel | ₹300-600 | >₹800 |
| Beauty & Personal Care | ₹200-450 | >₹600 |
| Electronics & Gadgets | ₹500-900 | >₹1,200 |
| Food & Supplements | ₹250-500 | >₹700 |
2. Average Order Value (AOV)
What it is: Total revenue ÷ Number of orders.
Why it matters on Shopify: AOV is your leverage point. A ₹200 increase in AOV can flip a loss-making brand to profitable without changing a single ad campaign. Shopify makes it easy to implement upsells, bundles, and minimum-order thresholds — but most brands don't track which strategies actually move AOV.
The AOV–Shipping relationship: In India, most couriers charge ₹60-80 for the first 500g. If your AOV is ₹500, shipping eats 12-16% of revenue. At ₹1,500 AOV, it drops to 4-5%. This is why AOV optimization is often more impactful than shipping rate negotiation.
3. Cost of Goods Sold (COGS)
What it is: Direct cost to produce/procure the product (materials, manufacturing, packaging).
Why it matters: COGS determines your gross margin ceiling. You can't automate or optimize your way past bad COGS. A product with 70% COGS has a 30% gross margin — after logistics, marketing, and operations, there's nothing left.
Target COGS for D2C profitability:
- Fashion: 30-45% of selling price
- Beauty: 20-35% of selling price
- Electronics: 45-60% of selling price
- Food/Supplements: 25-40% of selling price
4. Shipping Cost Per Order
What it is: Total courier charges (forward + RTO) ÷ Total orders shipped.
Why it matters on Shopify: This is where most Indian D2C brands hemorrhage margin. The visible cost is the forward shipping charge (₹60-80). The invisible cost is the RTO shipment you pay for twice — once to ship, once to return. A brand with 15% RTO rate is paying ~30% more in effective shipping costs than their rate card suggests.
The real formula:
Effective Shipping Cost = (Forward Cost × Total Orders) + (RTO Cost × RTO Orders) ÷ Successfully Delivered Orders
If you ship 1,000 orders at ₹70 each, and 150 come back as RTO at ₹50 return charge:
- Total shipping spend: ₹70,000 + ₹7,500 = ₹77,500
- Successfully delivered: 850
- Effective cost per delivered order: ₹91.18 (not ₹70)
Warning
Your courier rate card says ₹70/shipment. Your actual cost per delivered order is ₹91. That ₹21 gap, multiplied by thousands of orders per month, is where your profit disappears. Track effective shipping cost, not rate card cost.
5. Return to Origin (RTO) Rate
What it is: Orders returned before delivery ÷ Total orders shipped.
Why it matters: RTO is the silent profit killer for COD-heavy Shopify brands. Every RTO costs you: forward shipping + return shipping + repackaging labor + inventory holding cost + lost sale opportunity. For a ₹1,000 order, an RTO typically costs ₹180-250 in direct logistics alone.
How OrdersPilot tracks RTO impact: OrdersPilot doesn't just track your RTO percentage — it breaks it down by:
- By courier: Delhivery RTO: 8% vs. Shiprocket RTO: 14% → Route more through Delhivery
- By pin code: Mumbai 400001: 3% RTO vs. Rural Bihar: 22% RTO → Adjust COD availability
- By product: T-shirts: 5% RTO vs. Watches: 18% RTO → Require prepaid for watches
- By calling agent: Agent A: 7% RTO vs. Agent B: 15% RTO → Coach Agent B
This granularity is impossible with spreadsheets. It's automatic with an OMS.
6. Contribution Margin Per Order
What it is: Selling Price - COGS - Shipping - Payment Gateway Fee - Packaging.
Why it matters: This is the number that tells you if your business model works at the unit level. Everything else — salaries, rent, software — is overhead. If contribution margin is negative, scaling makes you lose money faster.
Example Calculation:
| Line Item | COD Order (₹1,200) | Prepaid Order (₹1,200) |
|---|---|---|
| Selling Price | ₹1,200 | ₹1,200 |
| COGS (35%) | -₹420 | -₹420 |
| Shipping (effective) | -₹91 | -₹70 |
| COD Remittance Fee (2%) | -₹24 | ₹0 |
| Payment Gateway (2%) | ₹0 | -₹24 |
| Packaging | -₹25 | -₹25 |
| RTO Cost (allocated) | -₹32 | ₹0 |
| CONTRIBUTION MARGIN | ₹608 (50.7%) | ₹661 (55.1%) |
Notice how COD orders have 4.4% lower contribution margin even before accounting for the customer acquisition cost. For brands with 70%+ COD, this gap compounds into lakhs per month.
7. Customer Lifetime Value (LTV)
What it is: Average revenue per customer over their entire relationship with your brand.
Why it matters: LTV is how you justify CAC. A ₹600 CAC is terrible for a one-time ₹1,200 purchase. It's excellent for a customer who buys 5 times over 12 months (LTV = ₹6,000).
The LTV:CAC Ratio:
- Below 2:1 — You're burning cash
- 2:1 to 3:1 — Sustainable but tight
- 3:1 to 5:1 — Healthy and scalable
- Above 5:1 — You're under-investing in growth
How to improve LTV on Shopify:
- Post-purchase WhatsApp flows (OrdersPilot automates this)
- Replenishment reminders for consumable products
- Loyalty programs with Shopify Flow integrations
- Bundle offers for returning customers
Building Your Profitability Dashboard
Tracking these 7 metrics in isolation is better than nothing. Tracking them in context is transformational. Here's what a profitability dashboard should show you daily:
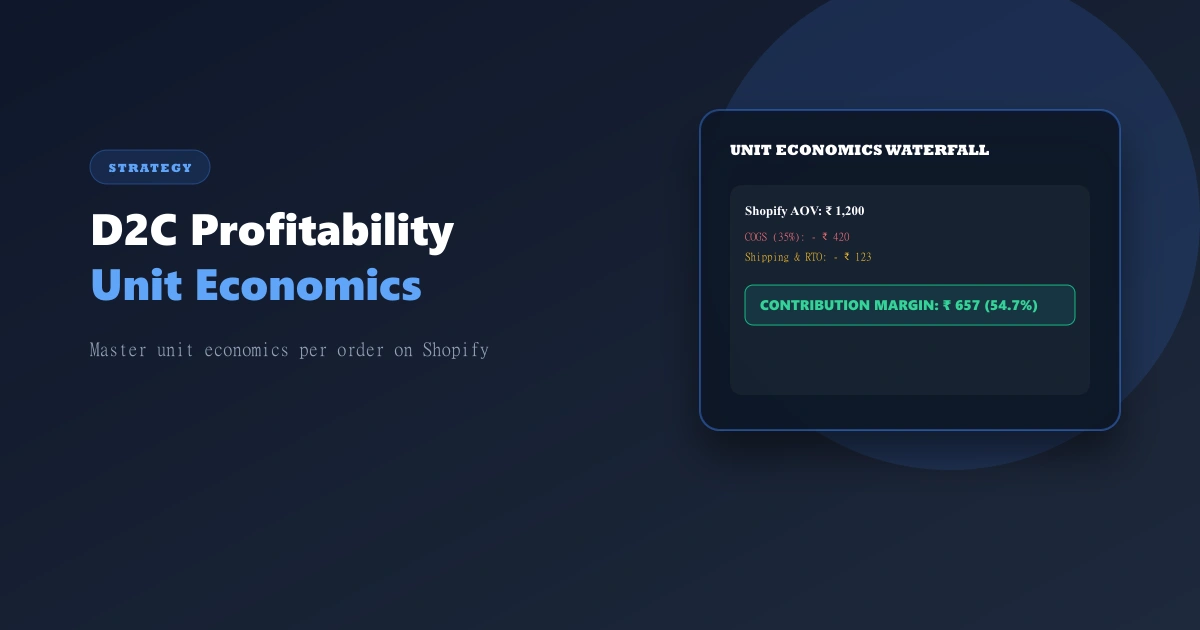
The P&L waterfall per order:
Revenue (₹1,200)
  └── COGS (-₹420)
      └── Gross Profit (₹780)
          └── Shipping (-₹91)
              └── Payment Fees (-₹24)
                  └── Packaging (-₹25)
                      └── RTO Allocation (-₹32)
                          └── Contribution Margin (₹608)
                              └── CAC Allocation (-₹400)
                                  └── Net Margin (₹208 = 17.3%)
Break it down further by:
- Product/SKU (which products are actually profitable?)
- City/pin code (where do you make money vs. lose it?)
- Courier (which shipping partner gives best margin?)
- Channel (Shopify store vs. marketplace vs. social commerce)
- Payment method (COD vs. prepaid contribution gap)
Tip
OrdersPilot's analytics dashboard provides this waterfall view automatically. Every order that flows through the system carries its full cost structure — from COGS tag to courier charge to RTO outcome. No spreadsheet assembly required.
The Profitability Levers: What to Fix First
Not all metrics are equally actionable. Here's where to focus based on impact vs. effort:
High Impact, Low Effort
- Reduce RTO by 5% → Saves ₹50,000-₹1,50,000/month (implement WhatsApp confirmations)
- Negotiate courier rates → Saves ₹20,000-₹60,000/month (use volume data from your OMS as leverage)
- Increase AOV by ₹200 → Adds ₹30,000-₹80,000/month margin (implement bundles on Shopify)
High Impact, Medium Effort
- Switch to multi-courier strategy → Saves ₹40,000-₹100,000/month (route based on courier performance data)
- Incentivize prepaid payments → Improves contribution margin by 4-5% per converted order
- Implement calling team performance management → Reduces RTO through better confirmation
High Impact, High Effort
- Build retention/LTV programs → 3-6 month payoff but transforms long-term economics
- Optimize product COGS → Requires supplier negotiation or reformulation
The Spreadsheet Trap
Here's the irony: the brands that most need profitability data are the ones least equipped to generate it.
If your order data lives in Shopify admin, shipping data in courier dashboards, ad spend in Meta Business Manager, and COGS in a Google Sheet — assembling a contribution margin calculation requires pulling data from 4+ sources, normalizing it, and hoping nothing is stale.
By the time you've built the spreadsheet, the data is 3 days old. By the time you've analyzed it, the campaign is over.
An OMS like OrdersPilot acts as the unifying data layer. Every order carries:
- Origin (which Shopify store?)
- Cost structure (COGS, shipping, fees)
- Confirmation status (calling team outcome)
- Fulfillment status (courier, tracking, delivery)
- Financial outcome (delivered vs. RTO vs. cancelled)
This means your profitability metrics are always current, always granular, and always actionable.
Frequently Asked Questions (FAQ)
1. What is the most important unit economics metric for D2C brands?
Contribution margin per order. It tells you whether your business model works at the unit level, before any overhead. If contribution margin is negative, scaling the business only accelerates losses. Focus on making each order profitable before investing in growth.
2. How do I calculate the true shipping cost per order?
Don't use your courier rate card. Calculate effective shipping cost by adding forward shipping costs and RTO shipping costs, then dividing by successfully delivered orders only. For a brand with 15% RTO, the effective cost per delivered order can be 25-30% higher than the rate card.
3. What's a healthy LTV:CAC ratio for Indian D2C brands?
For sustainable growth, target a 3:1 ratio or better. This means if your CAC is ₹500, your customer lifetime value should be at least ₹1,500. Brands below 2:1 are typically burning cash and should either reduce CAC through organic channels or increase LTV through retention programs.
Related Guides
- Why COD Orders Require a Different Ops System: Understand the cost gap between COD and prepaid at the operational level.
- Reducing RTO Rates: D2C Case Study: See how reducing RTO directly improved unit economics.
- Scaling D2C Operations: From 500 to 5,000 Orders: How profitability scales (or breaks) as order volume grows.
Ready to see your real profitability numbers? Schedule a demo to see how OrdersPilot gives you per-order unit economics, real-time contribution margin tracking, and the data layer to make profitable decisions daily.
Author
Growth Team
Deeply passionate about optimizing e-commerce logistics and building systems that help D2C founders regain control of their operations.
Enjoyed this article?
If you found this helpful, share it with your network and help other Shopify founders scale their operations.
Recommended Articles
Continue your journey with more insights from our team.